Operational Metrics
The below links to operational metric dashboards have been created by various units within The Division of Information Technology. These dashboards provide quick visualizations for a variety of IT related information.
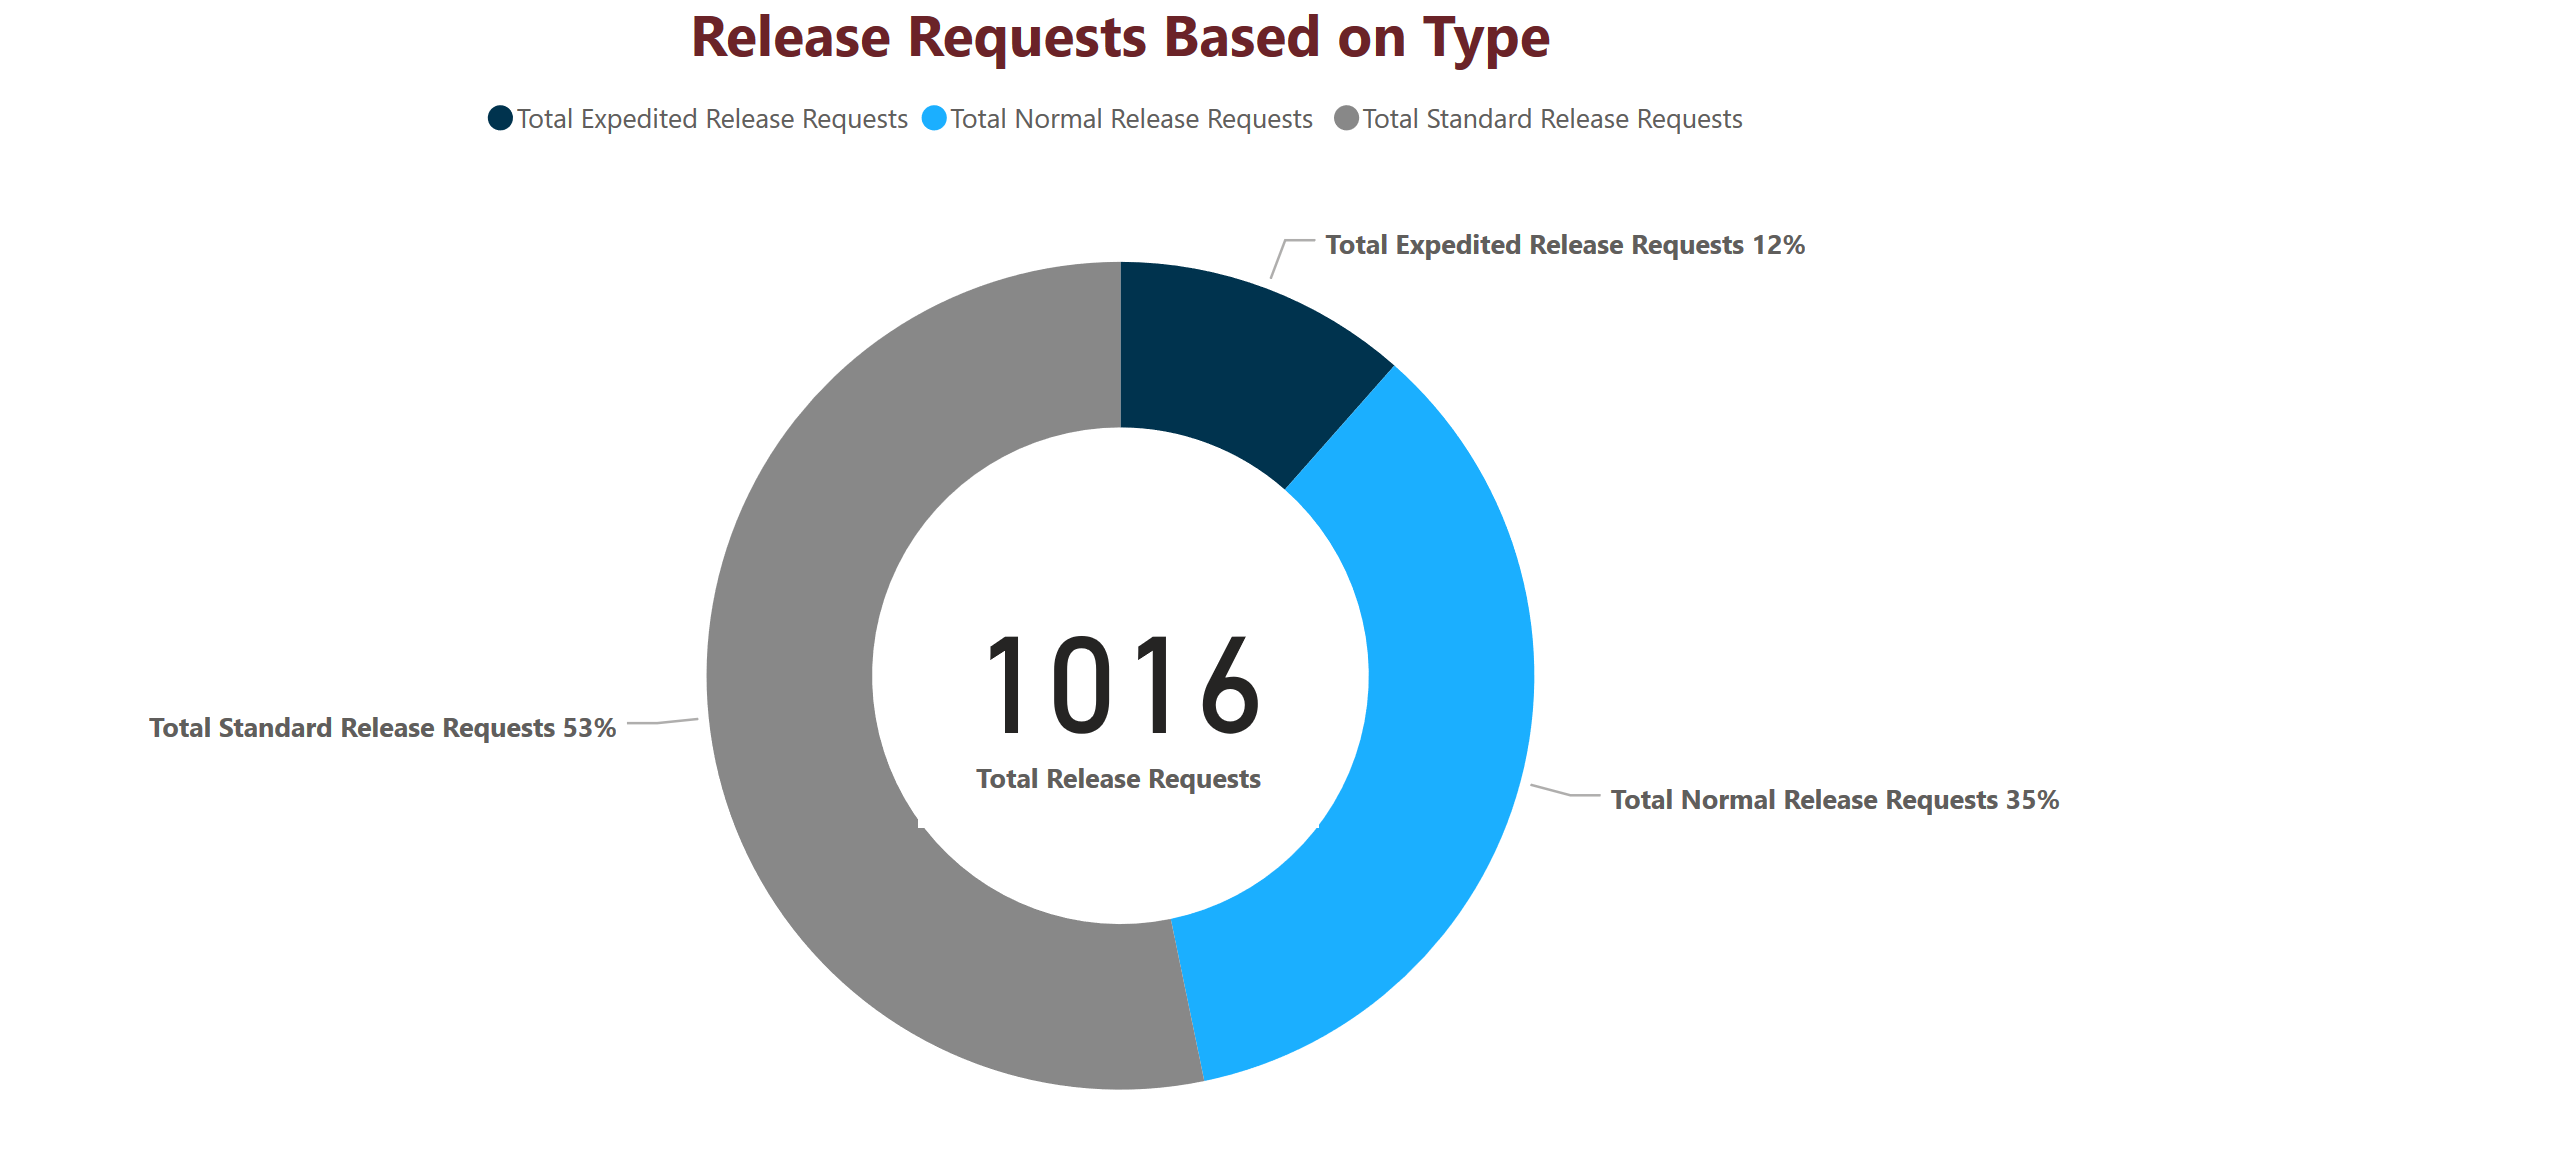
Change Management Metrics
Description: The Division of Information Technology adheres to strict change management policies and we pride ourselves in our change management, communication, and approval procedures. This dashboard displays the total number of year-to-date release requests and the average time taken to approve those requests in the system.
Updated: Weekly
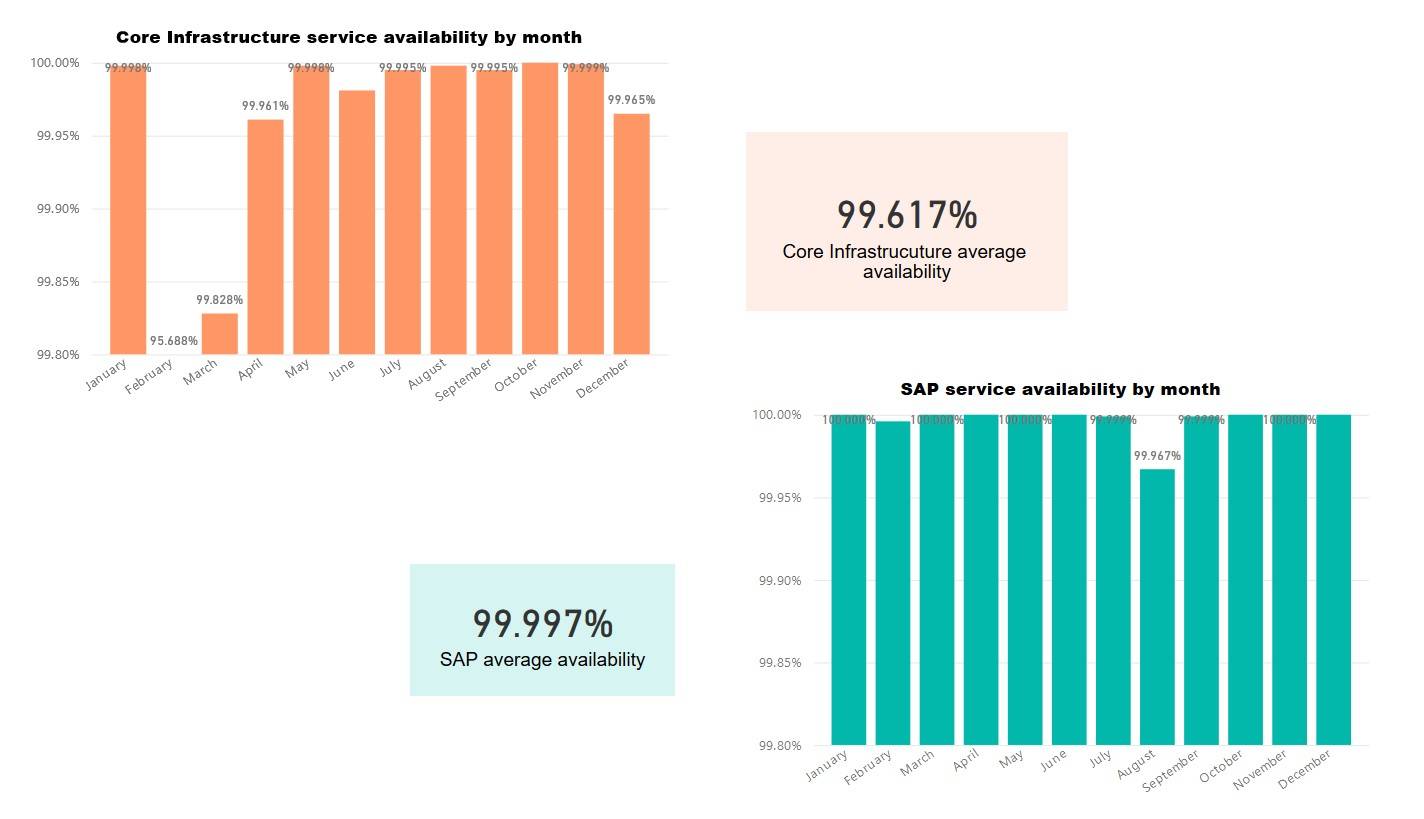
System Availability
Description: System and application up-time is crucial for the division and the university. University business demands reliable system availability. This dashboard displays the service availability for core infrastructure items such as shibboleth authentication, storage servers, virtual machines, and SAP.
Updated: Monthly.
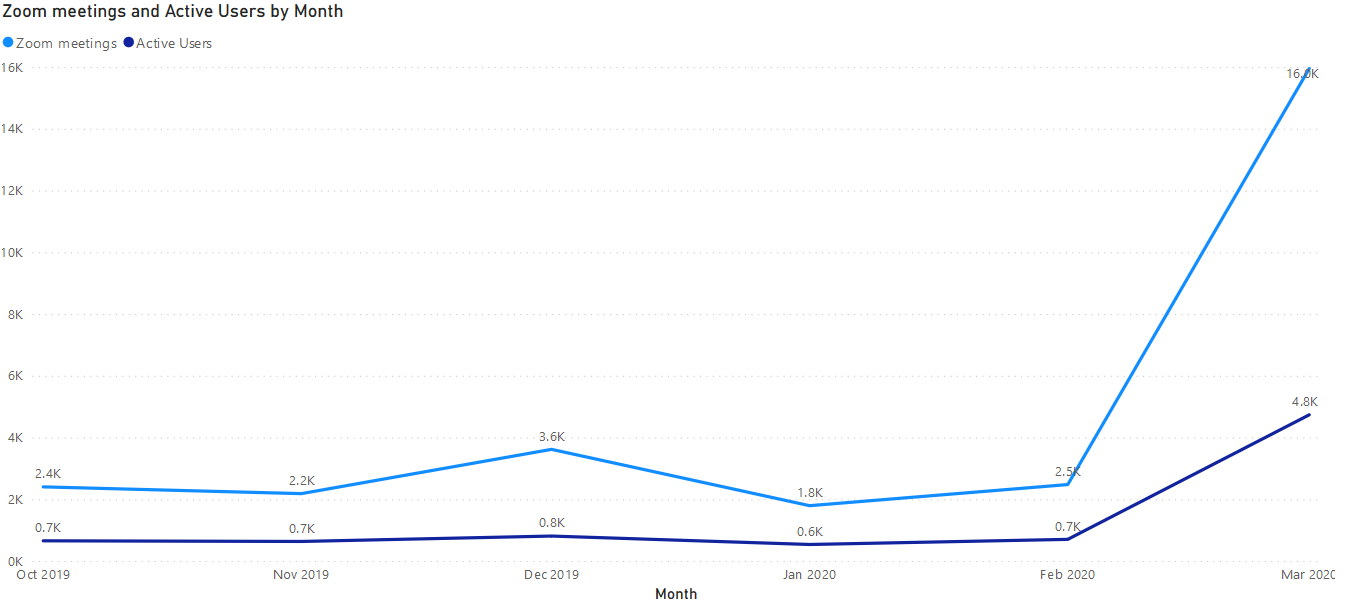
Zoom Users and Meetings
Description: Zoom has become a staple application at the university. This report depicts the number of Zoom meetings held monthly alongside the number of active users.
Updated: Monthly.
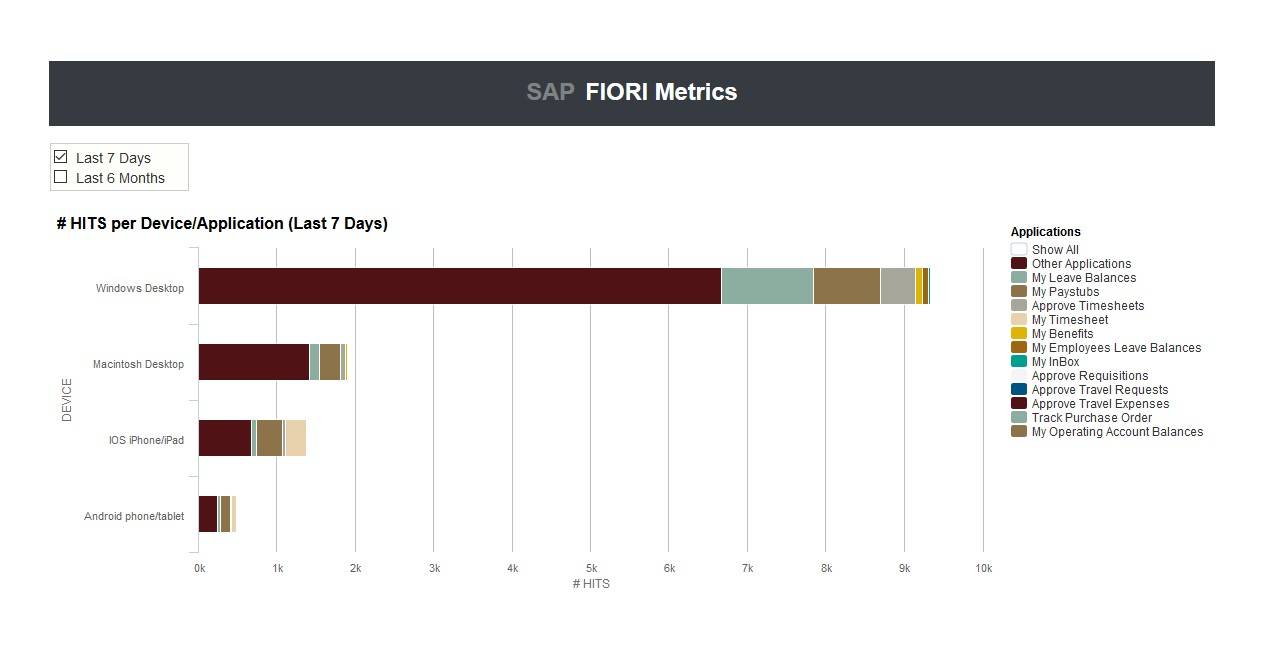
SAP Fiori Metrics
Description: This dashboard displays the device and application usage for SAP Fiori. Please note this report requires authentication and VPN access.
Updated: Daily
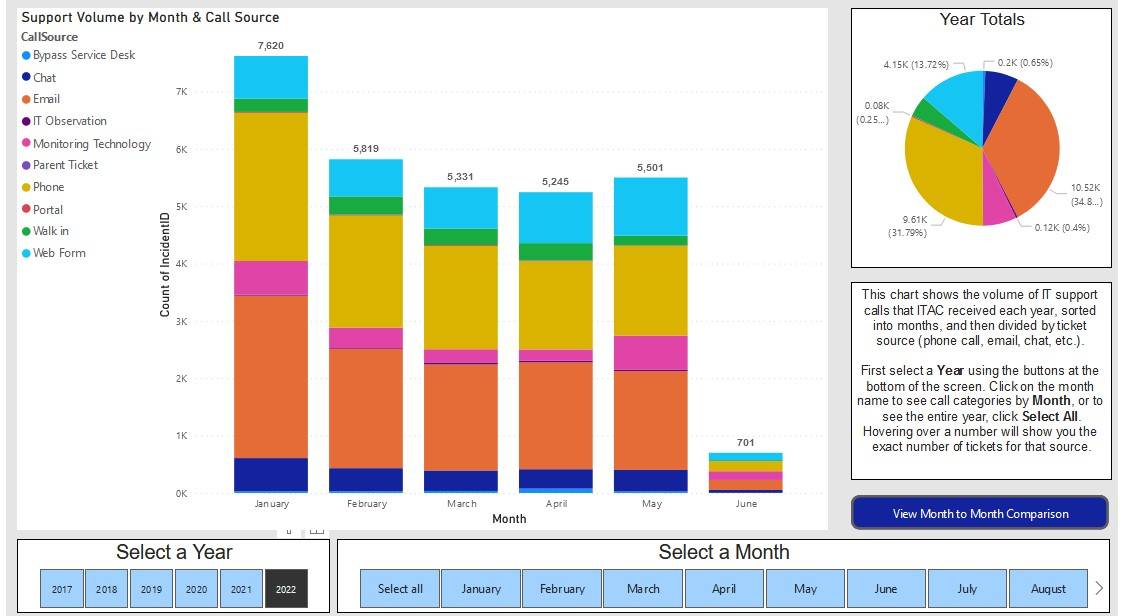
ITAC Support Volume
Description: Displays the volume of IT support calls ITAC received per year, sorted by month, and divided by the ticket source (phone call, email, chat, etc.)
Updated: Daily
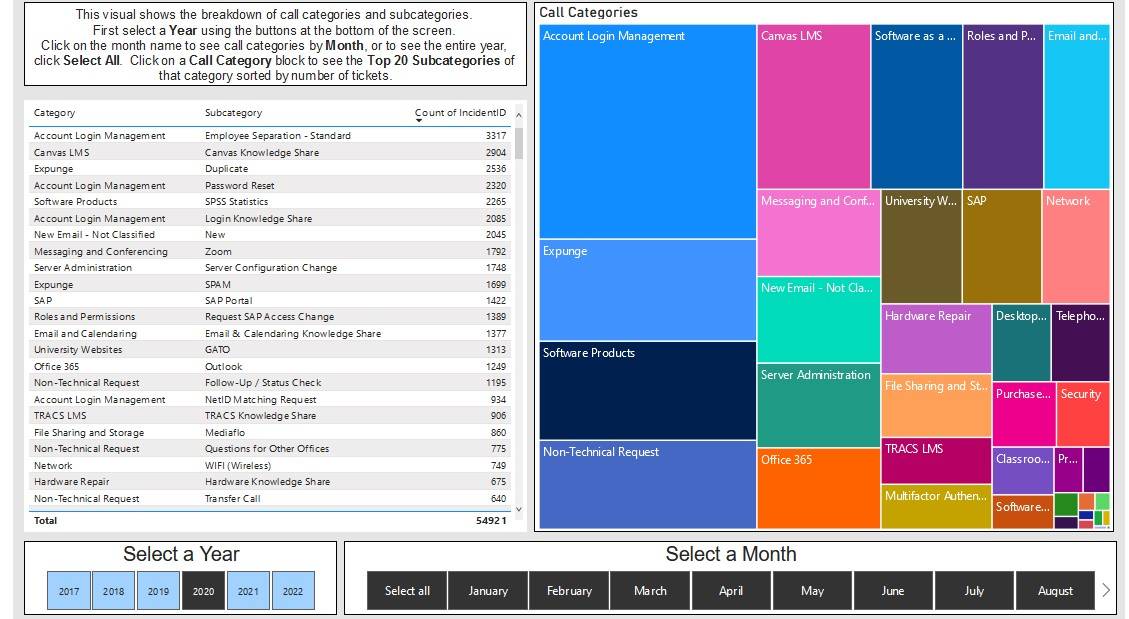
ITAC Call Categories
Description: Displays the breakdown of call categories and subcategories such as Canvas, Network, Office 365, etc.
Updated: Daily
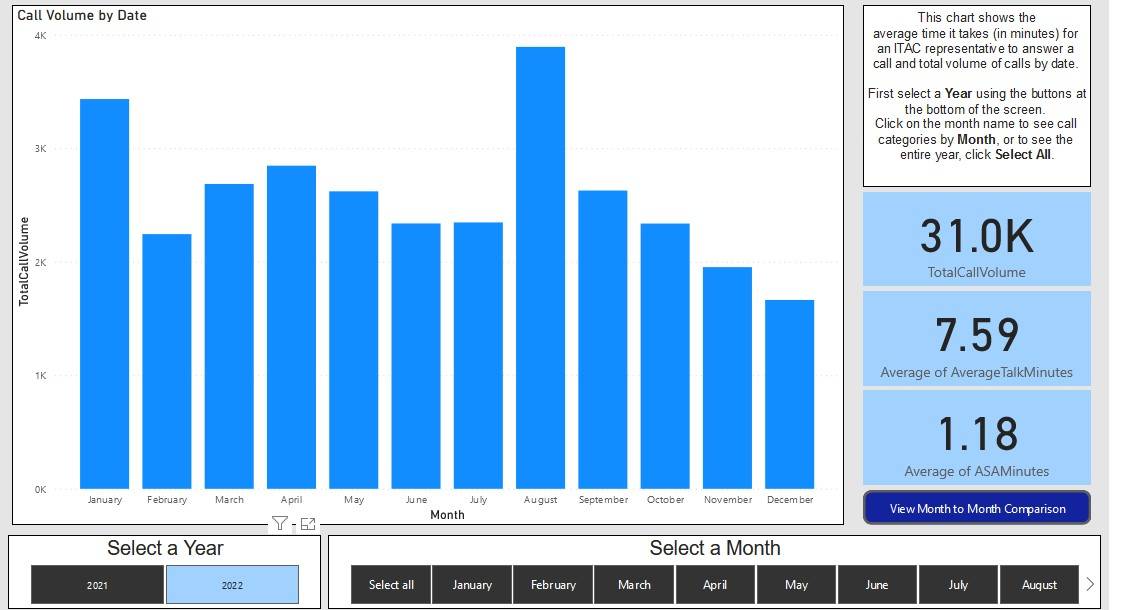
ITAC Call Volume and Average Wait Time
Description: Displays the volume and average call wait time by month.
Updated: Daily
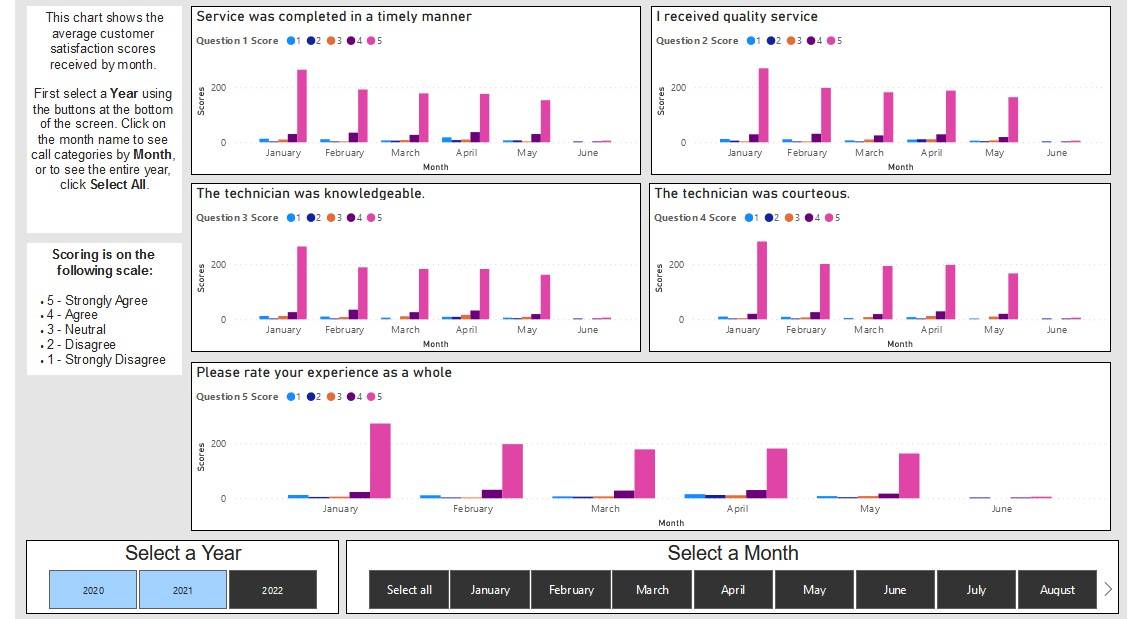
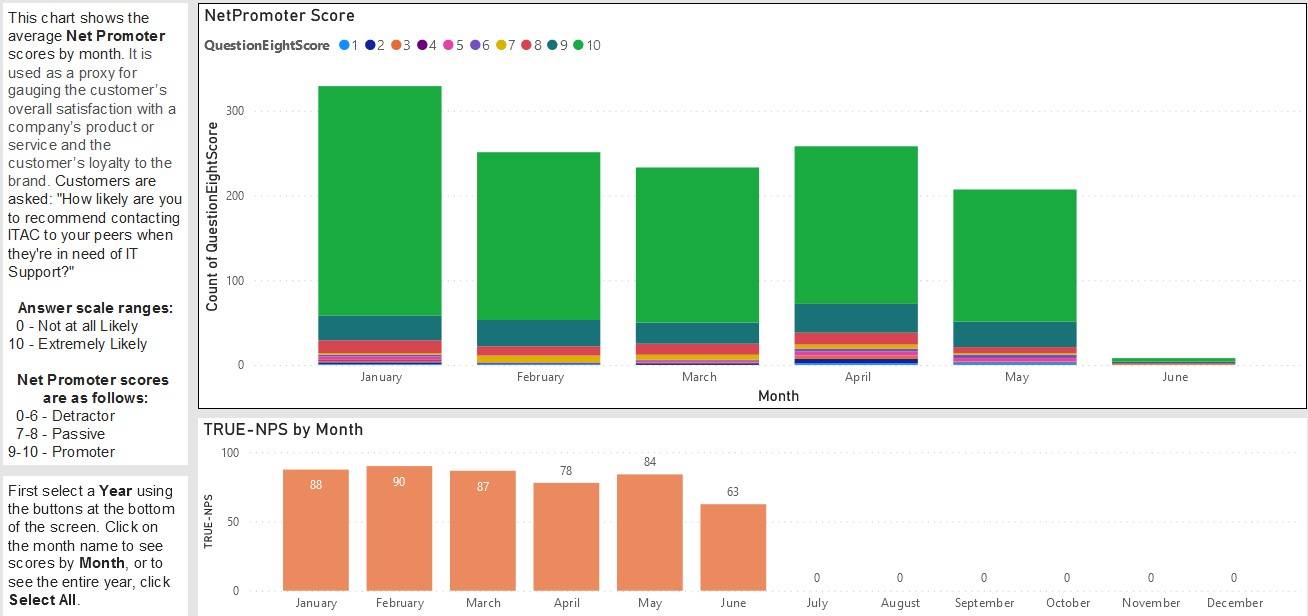
ITAC Customer Satisfaction Scores
Description: Displays the average customer satisfaction scores received by month.
Updated: Daily
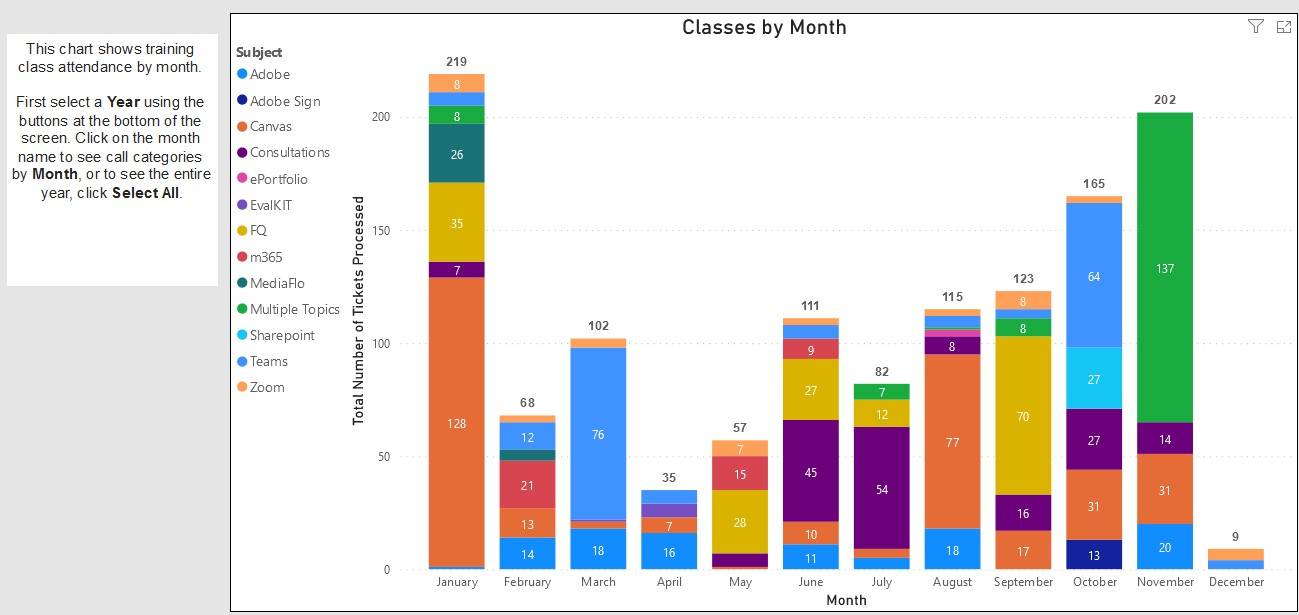
ITAC Training Class Attendance
Description: Displays ITAC monthly training class attendance.
Updated: Daily
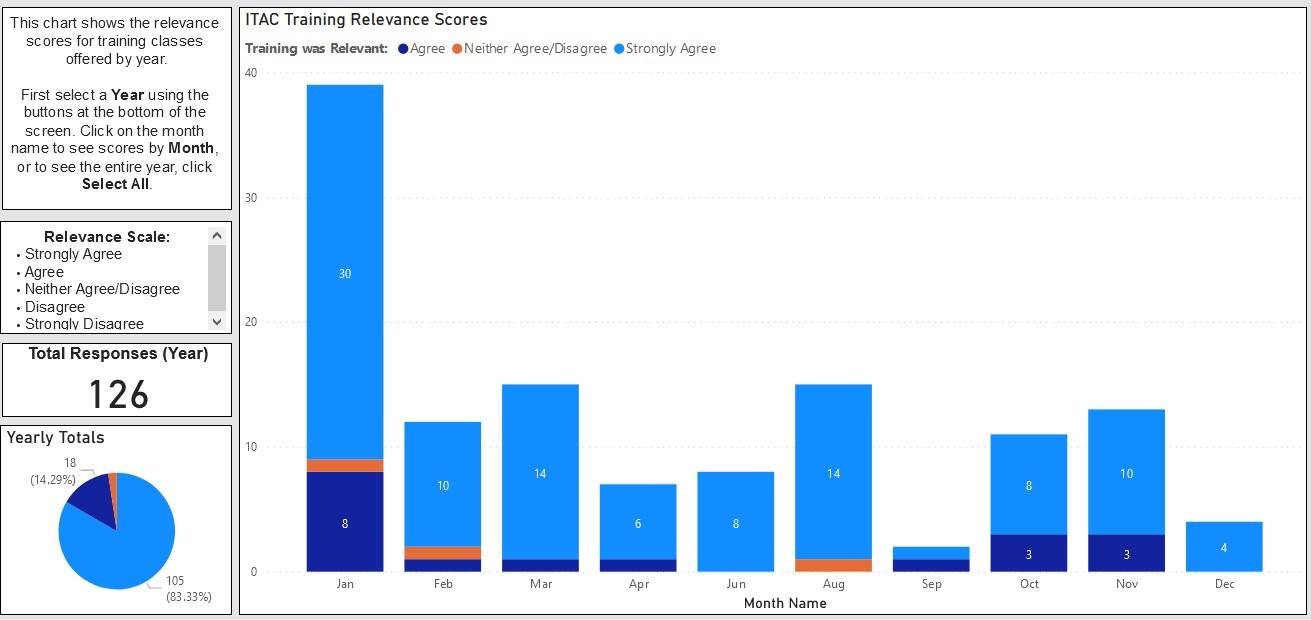
ITAC Training Class Relevance
Description: Displays ITAC training class relevance scores.
Updated: Daily
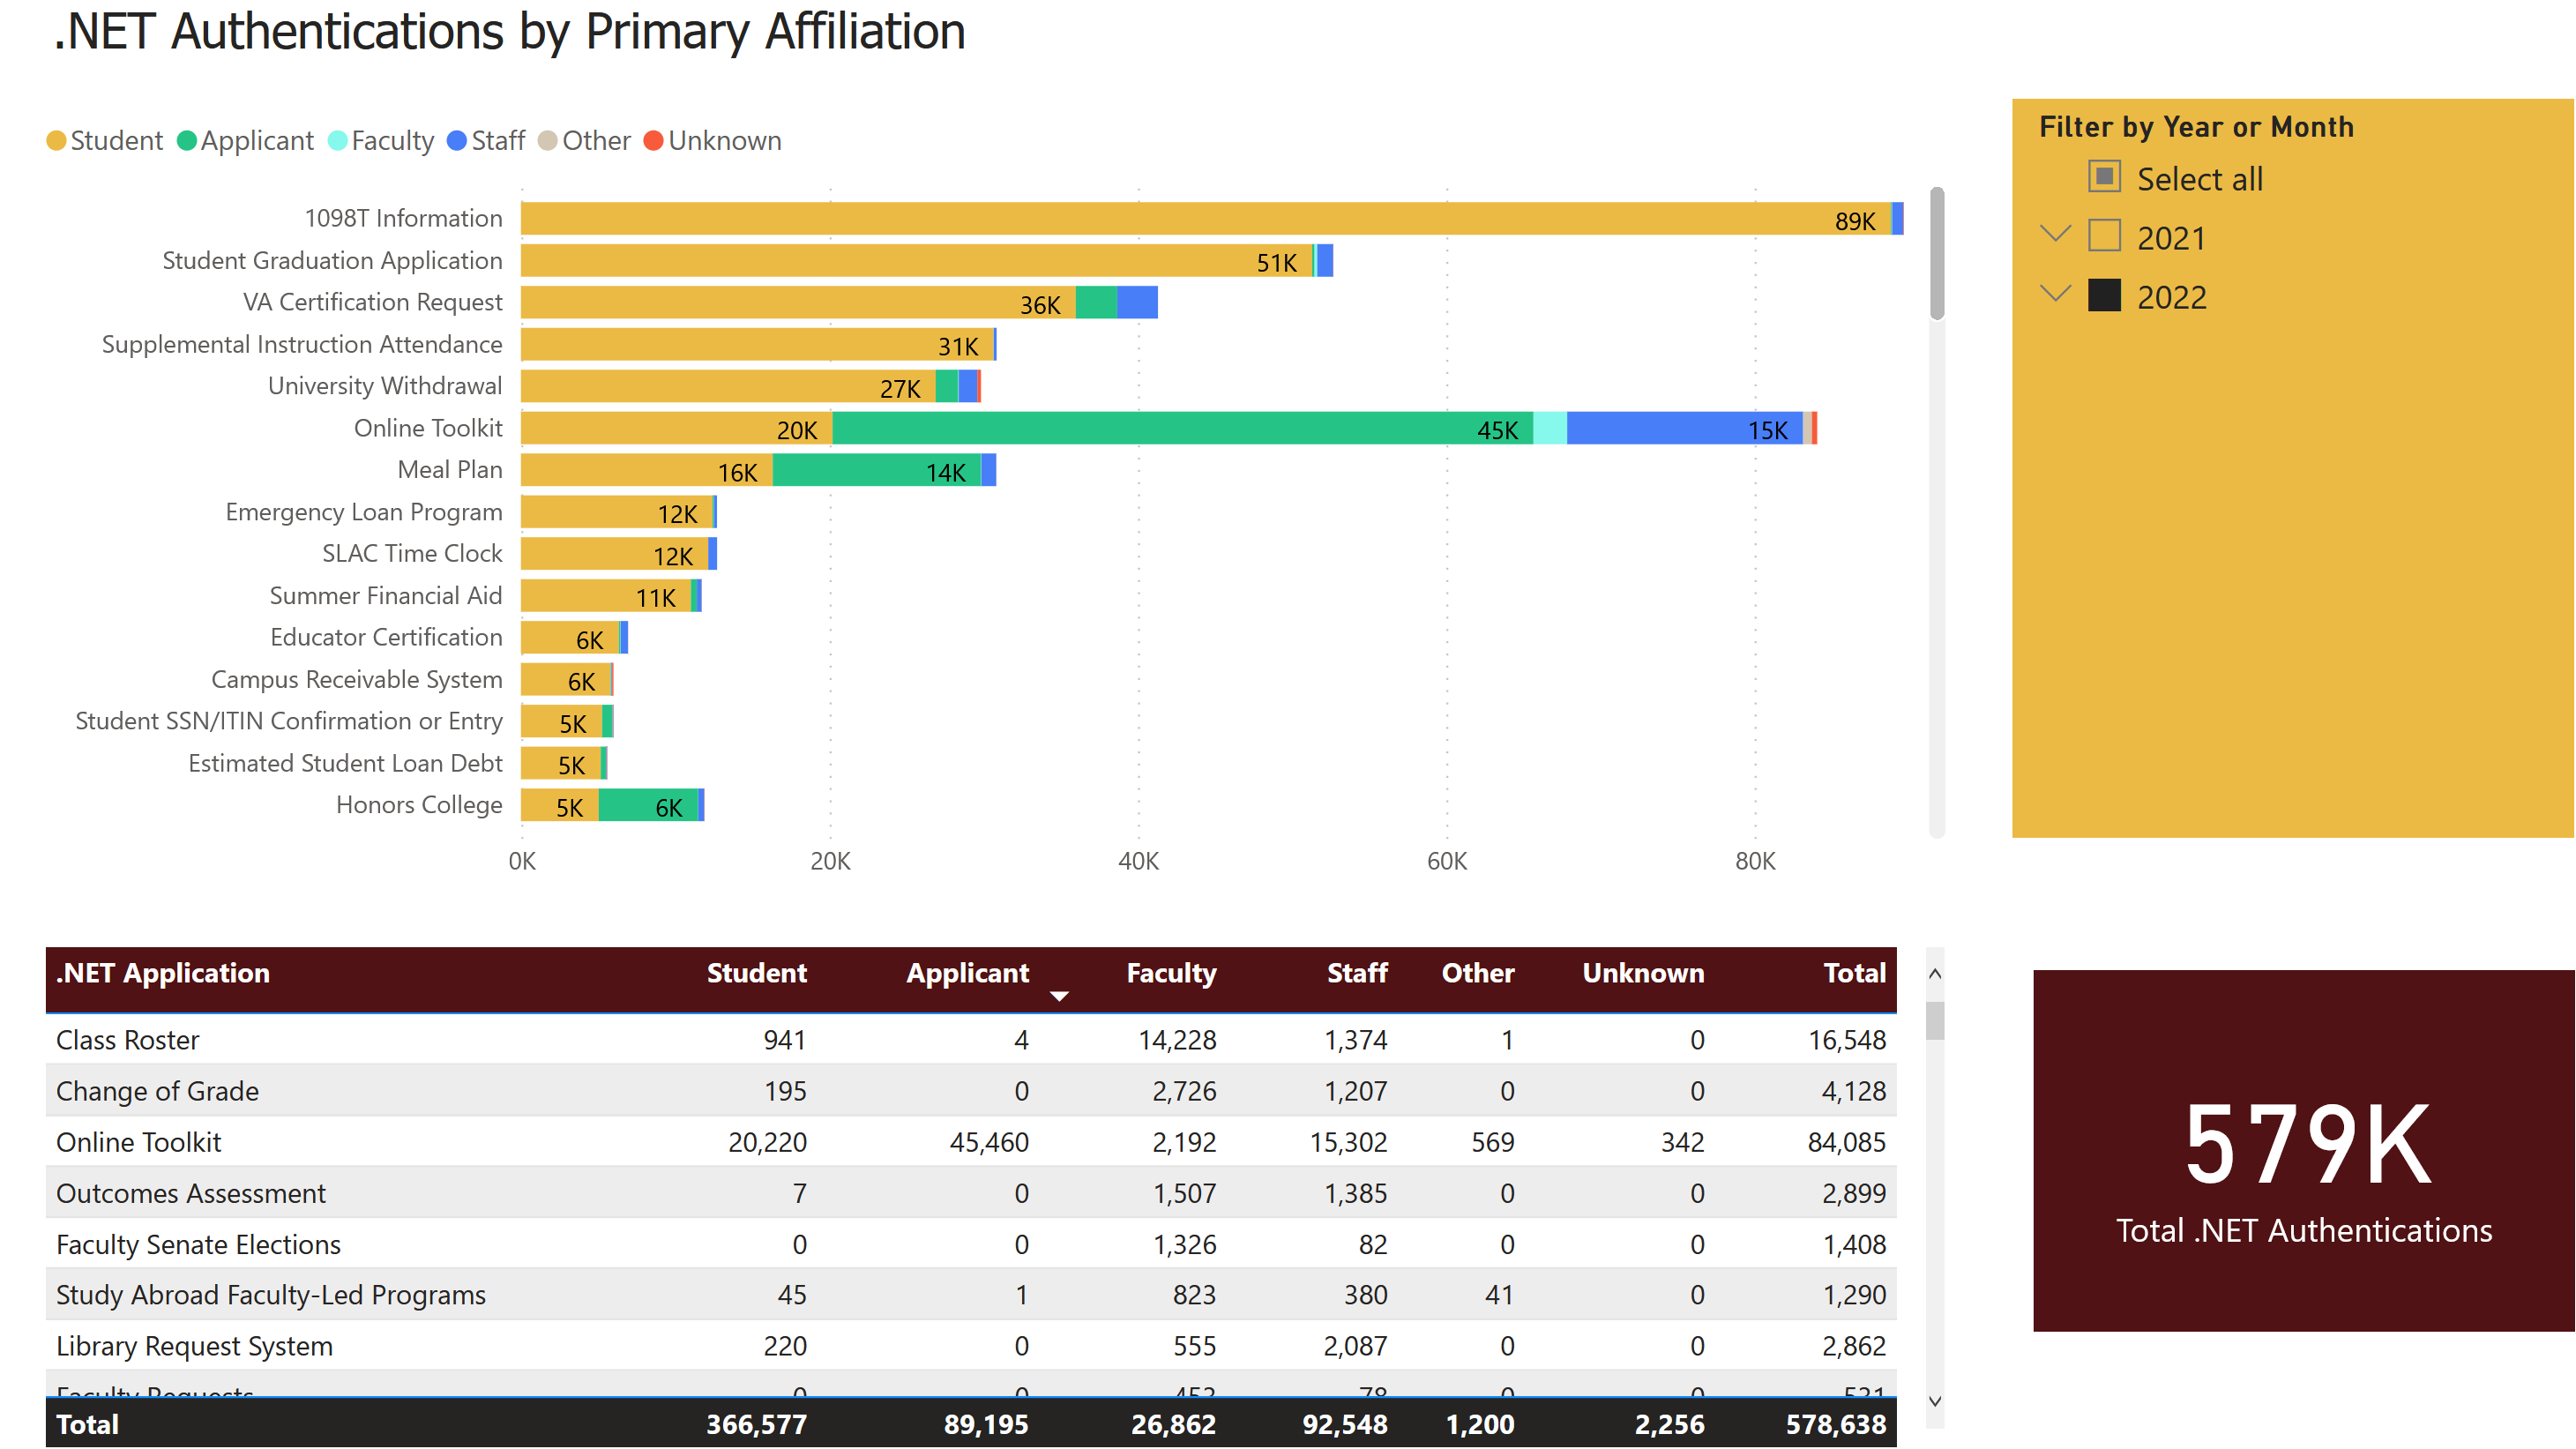
.NET Authentications by University Affiliation
Description: More than seventy .NET web applications have been developed to provide services for the university. This dashboard displays the number of authentications into each .NET application based on the person’s TXST primary affiliation (Student, Applicant, Faculty, Staff, etc.). The dashboard can be filtered by specific years or months to view seasonal differences in utilization.
Updated: Monthly
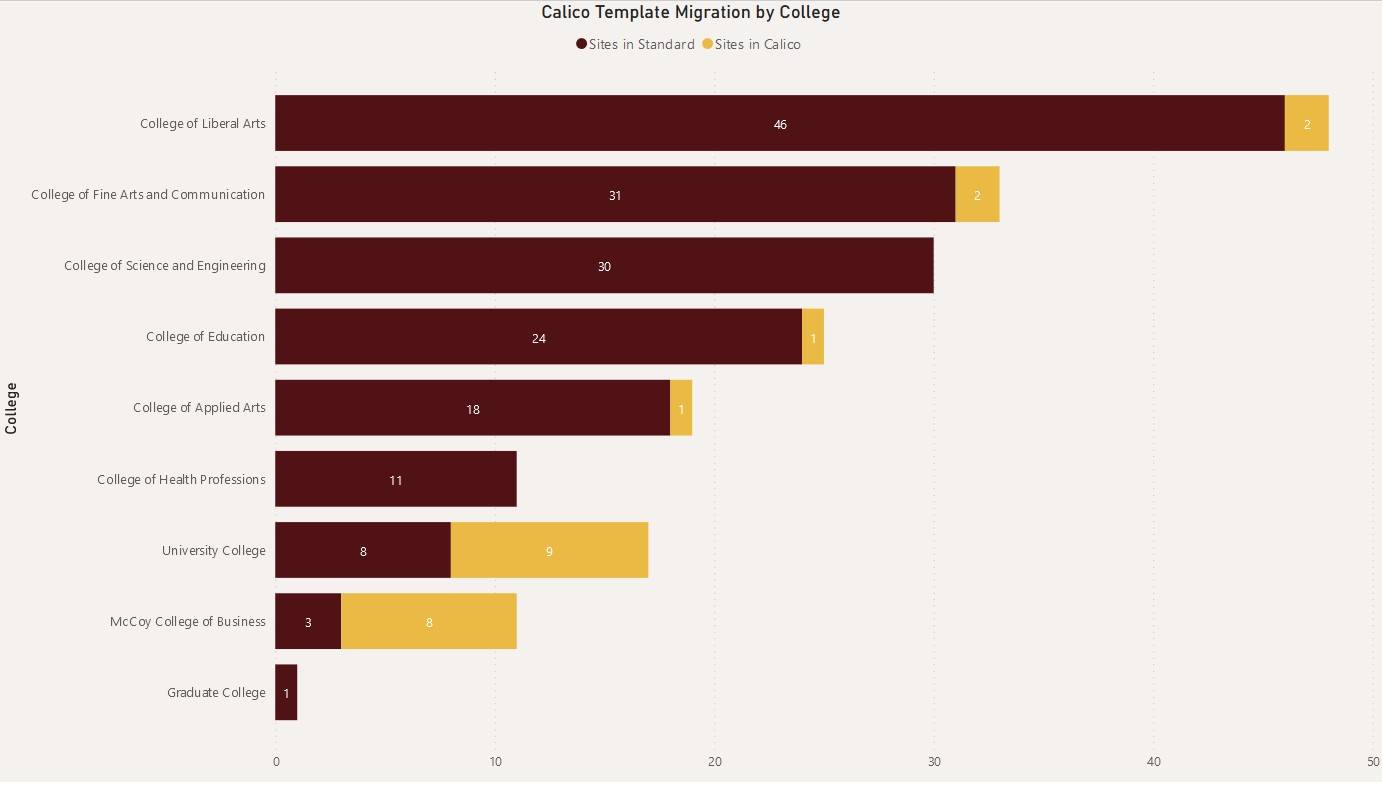
Calico Website Template Migration
Description: Early in 2021, all university websites were given approval to begin planning and transitioning their websites into the new, mobile-friendly Calico template. This report is to help depict the progress of the academic departments as they transition.
Updated: Monthly
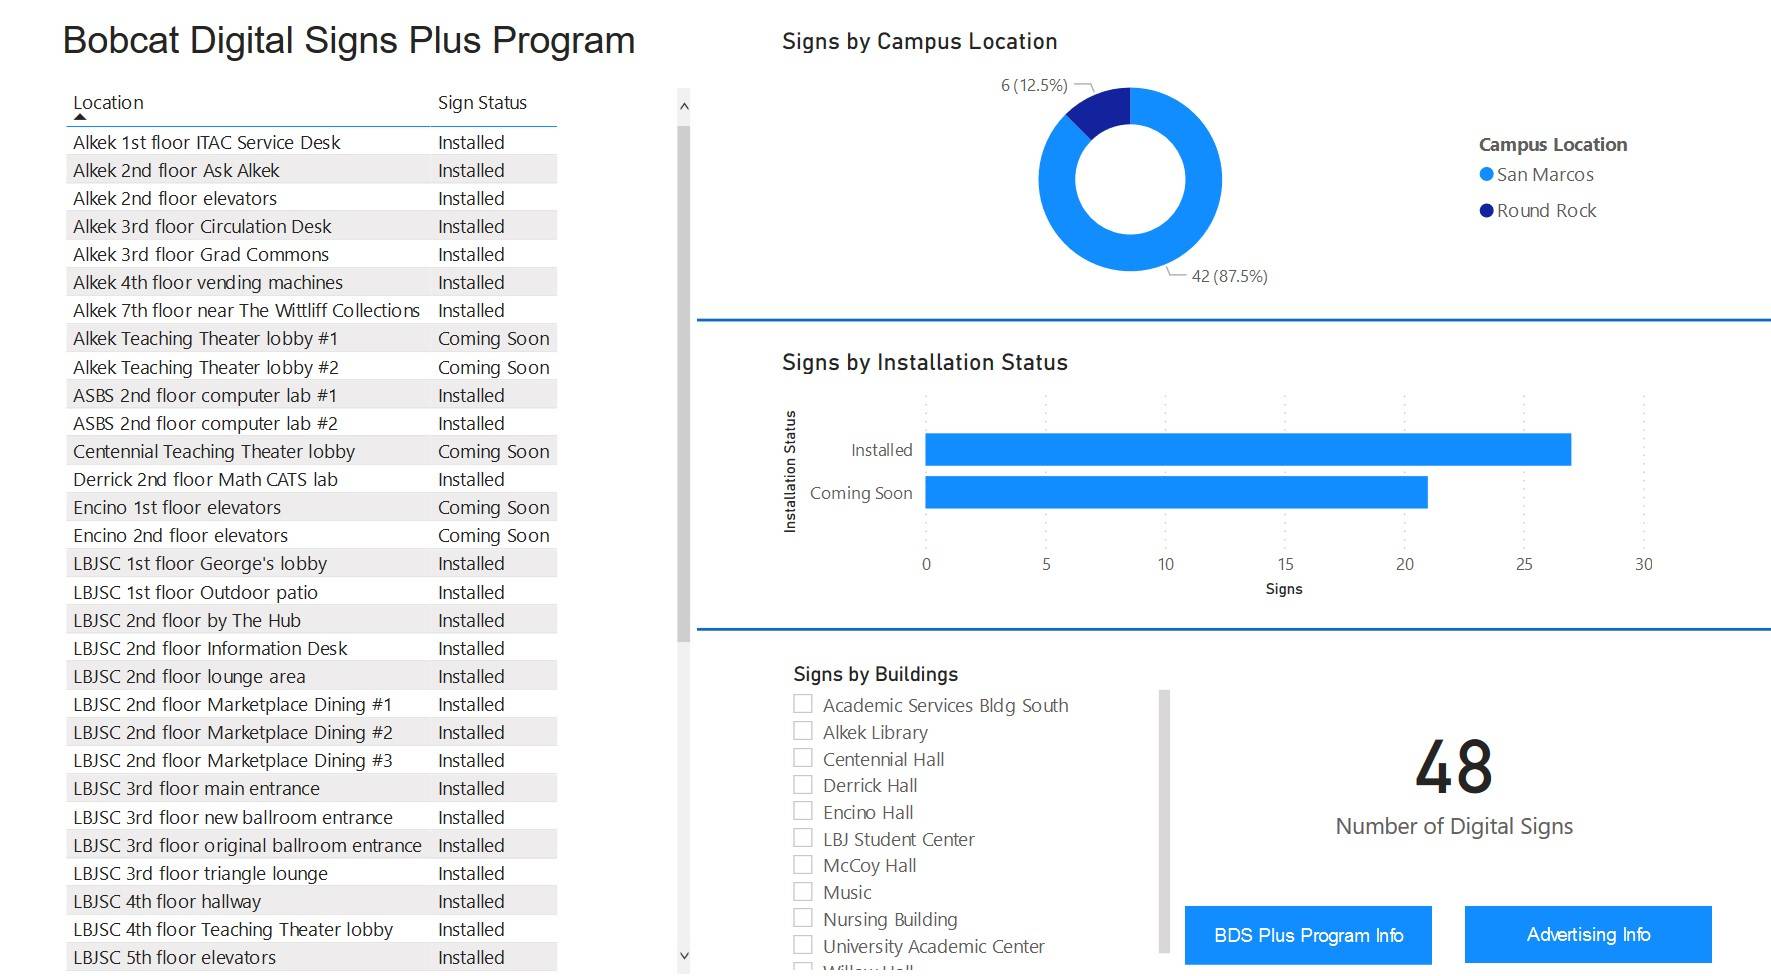
Bobcat Digital Signs
Description: Bobcat Digital Signs, the digital sign solution for the university, is quickly becoming a sought-after service on campus. The usage, roll-out, display location, and display installation status can all be tracked using this dashboard.
Updated: Monthly.
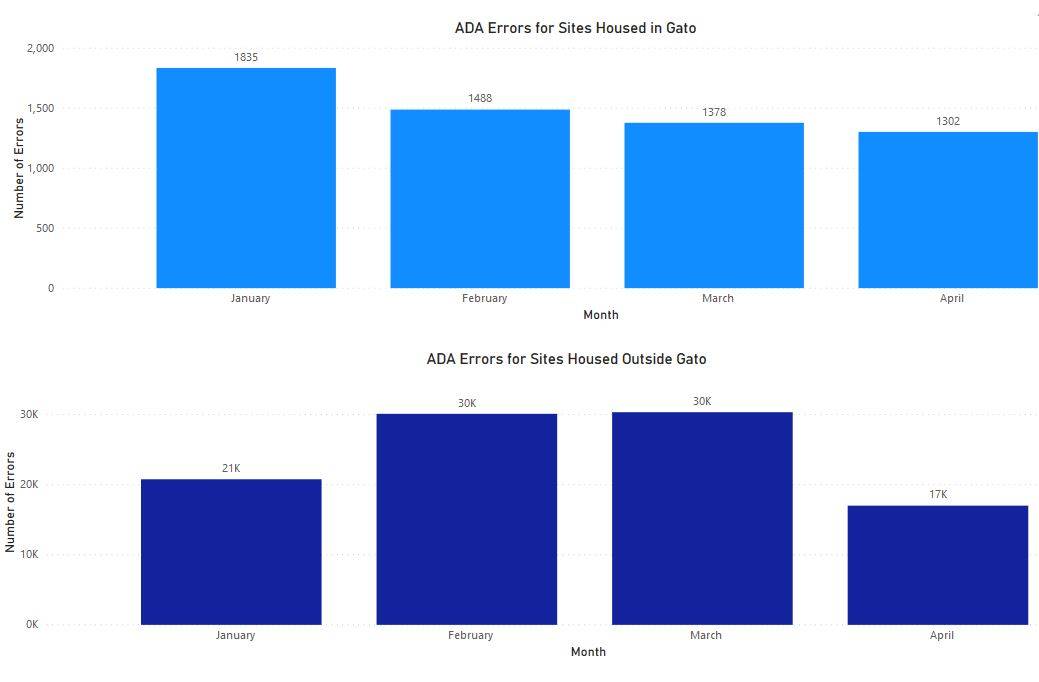
Website Accessibility Report
Description: Displays the number of ADA issues found on webpages managed by Texas State.
Updated: Monthly
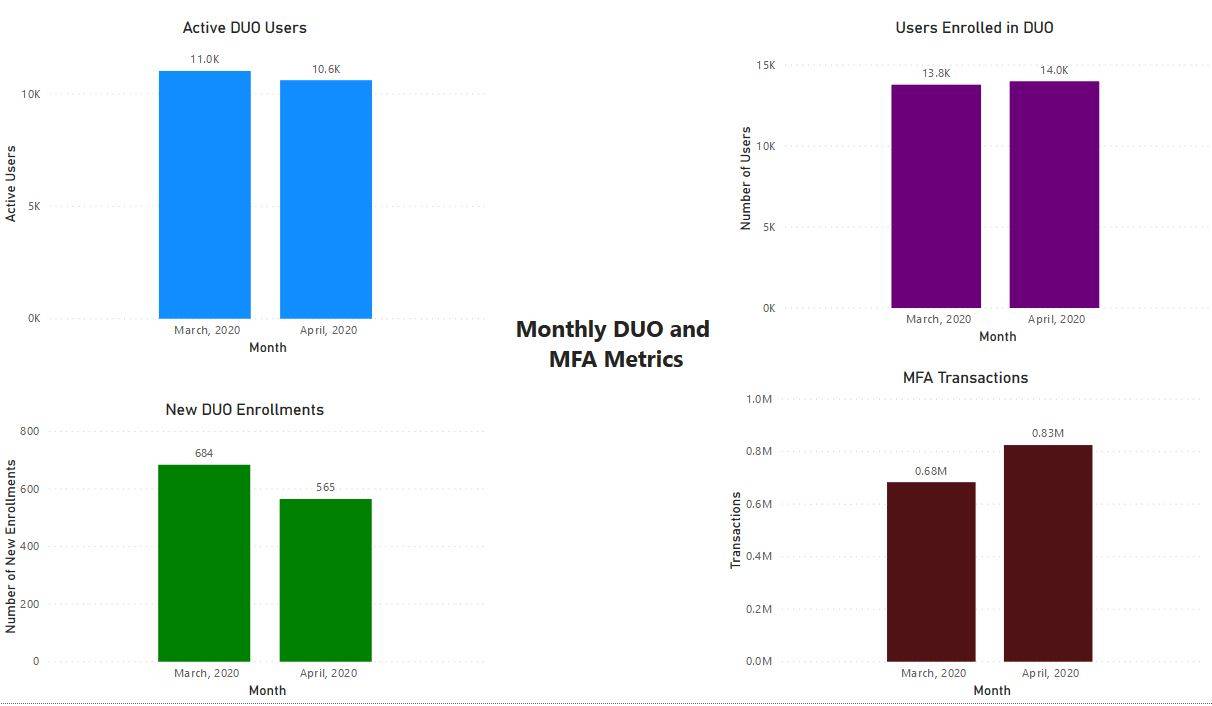
DUO and MFA Usage
Description: Displays the number of users in DUO and the number of multi-factor authentication transactions.
Updated: Monthly.